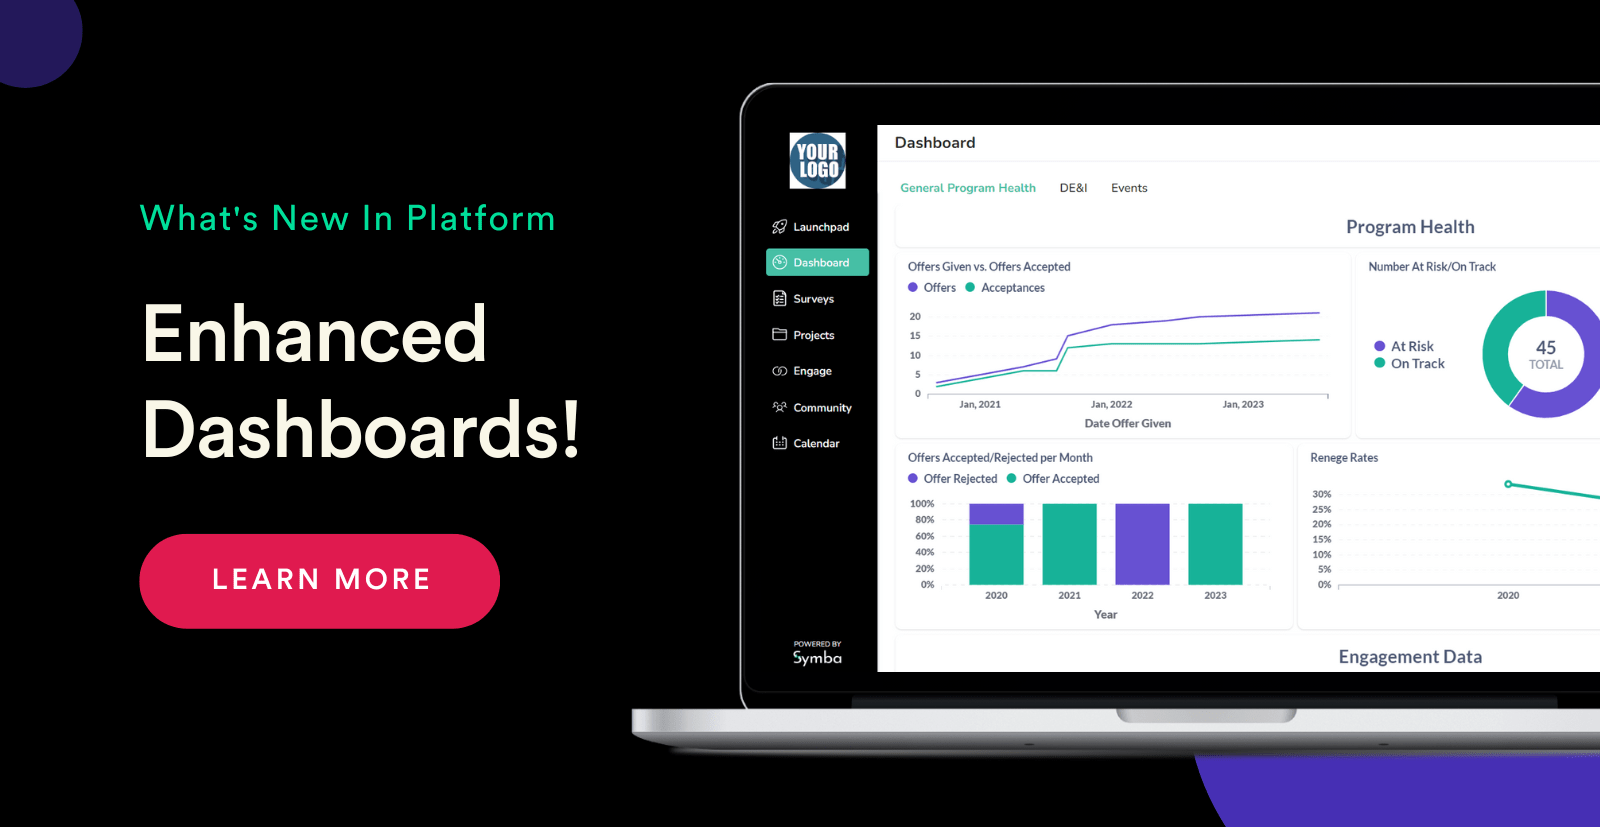
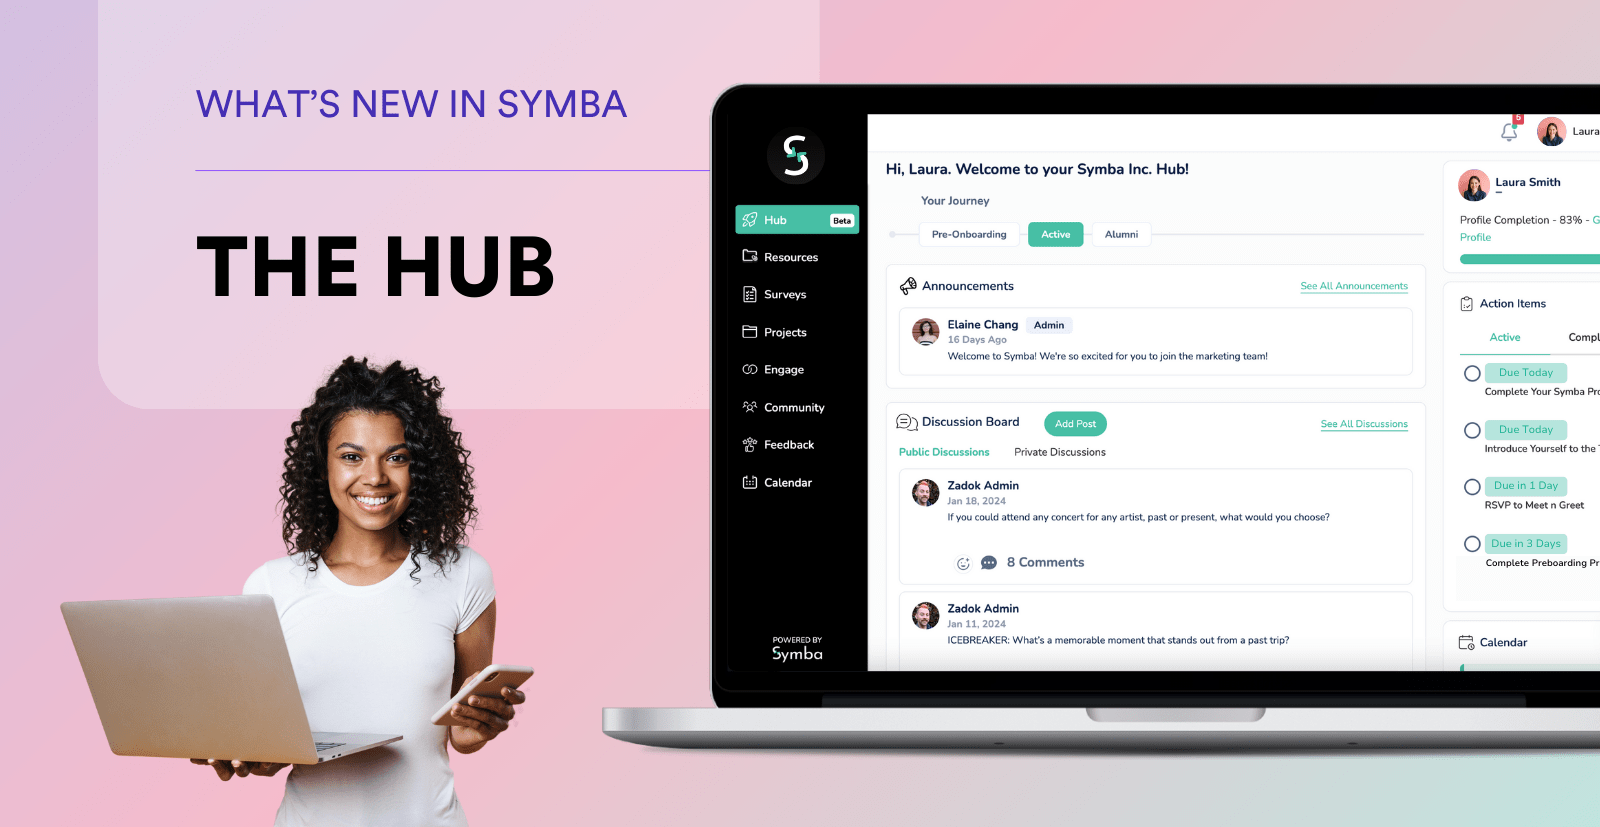
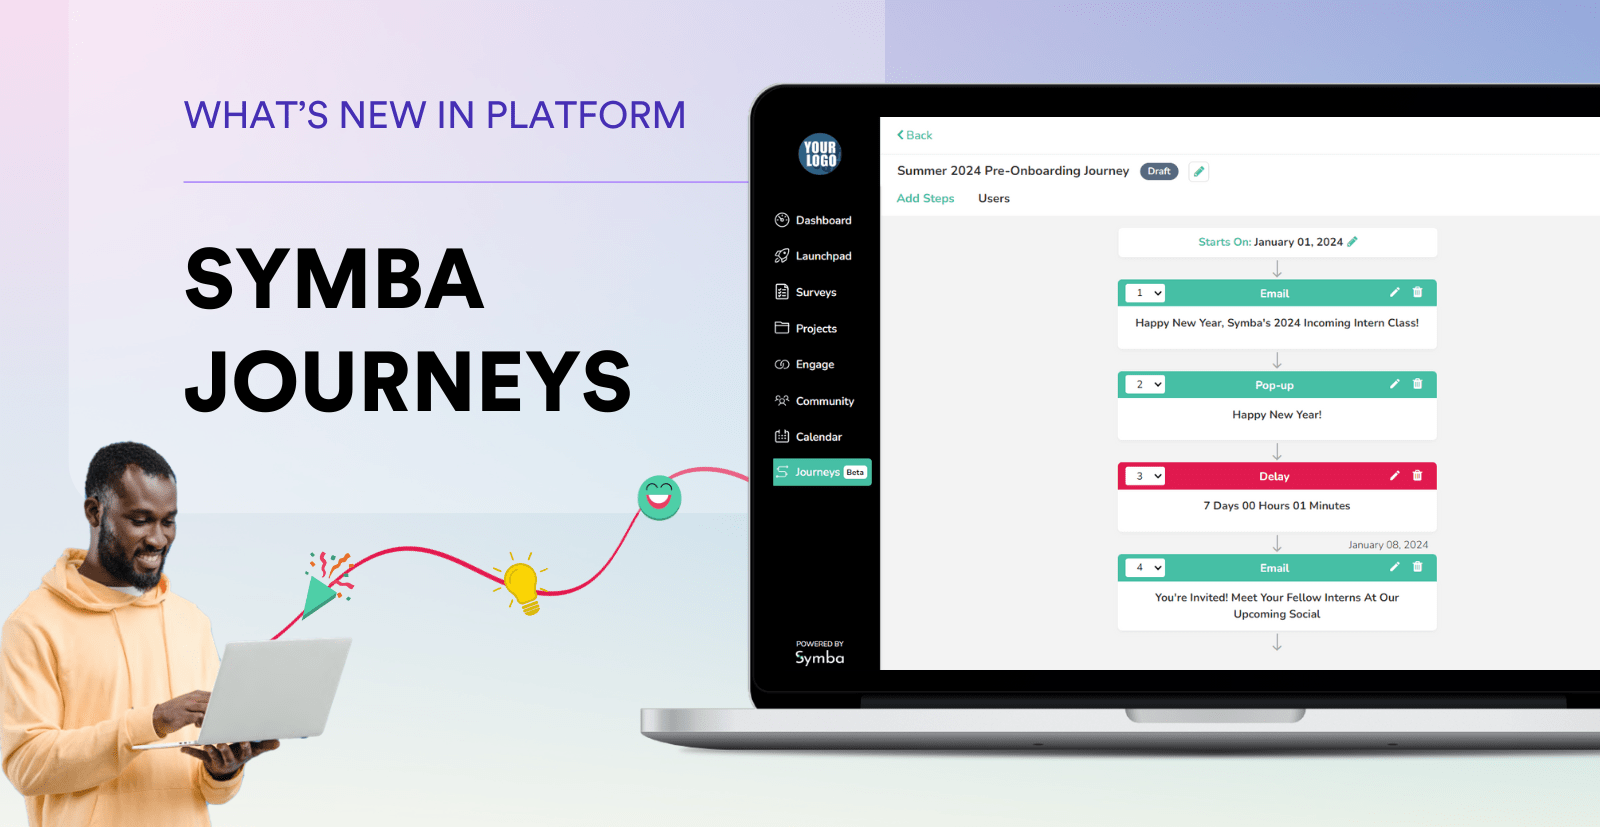
???? Product alert! We've revamped our Dashboards feature. Customers now have access to additional out-of-the-box reports in the General Program Health Dashboard and, drumroll, in the new DEI (Diversity, Equity, and Inclusion) and Events Dashboards. Our enhanced Dashboards feature is designed to empower you with the data you need to make informed decisions about your early talent strategy, track engagement and performance, and drive meaningful improvements to foster inclusion and belonging.
General Program Health Dashboard
This Dashboard is your go-to tool for obtaining a high-level overview of your program’s performance. Here, you'll find an array of charts and graphs that shed light on essential program data, such as early talent conversions, reneges, job offer acceptance rates, and more. Additionally, you can monitor the progress of your early talents' projects, get insight into engagement, and keep track of program participant start and end dates. With this holistic view, you can quickly understand how your program is doing, spot areas for improvement, and celebrate successes.
DEI Dashboard
Early career programs are a powerful pipeline for diverse talent. Our new DEI Dashboard provides a deep dive into the demographic makeup of your program. Track the gender and racial diversity of your program over time, assess whether it's becoming more inclusive, and gain insights into changes you might need to improve your early talent DEI initiatives. Moreover, the dashboard allows you to measure conversion rates, renege rates, and engagement by gender and race, providing a vital measure of your program's inclusivity and effectiveness in fostering diverse talent.
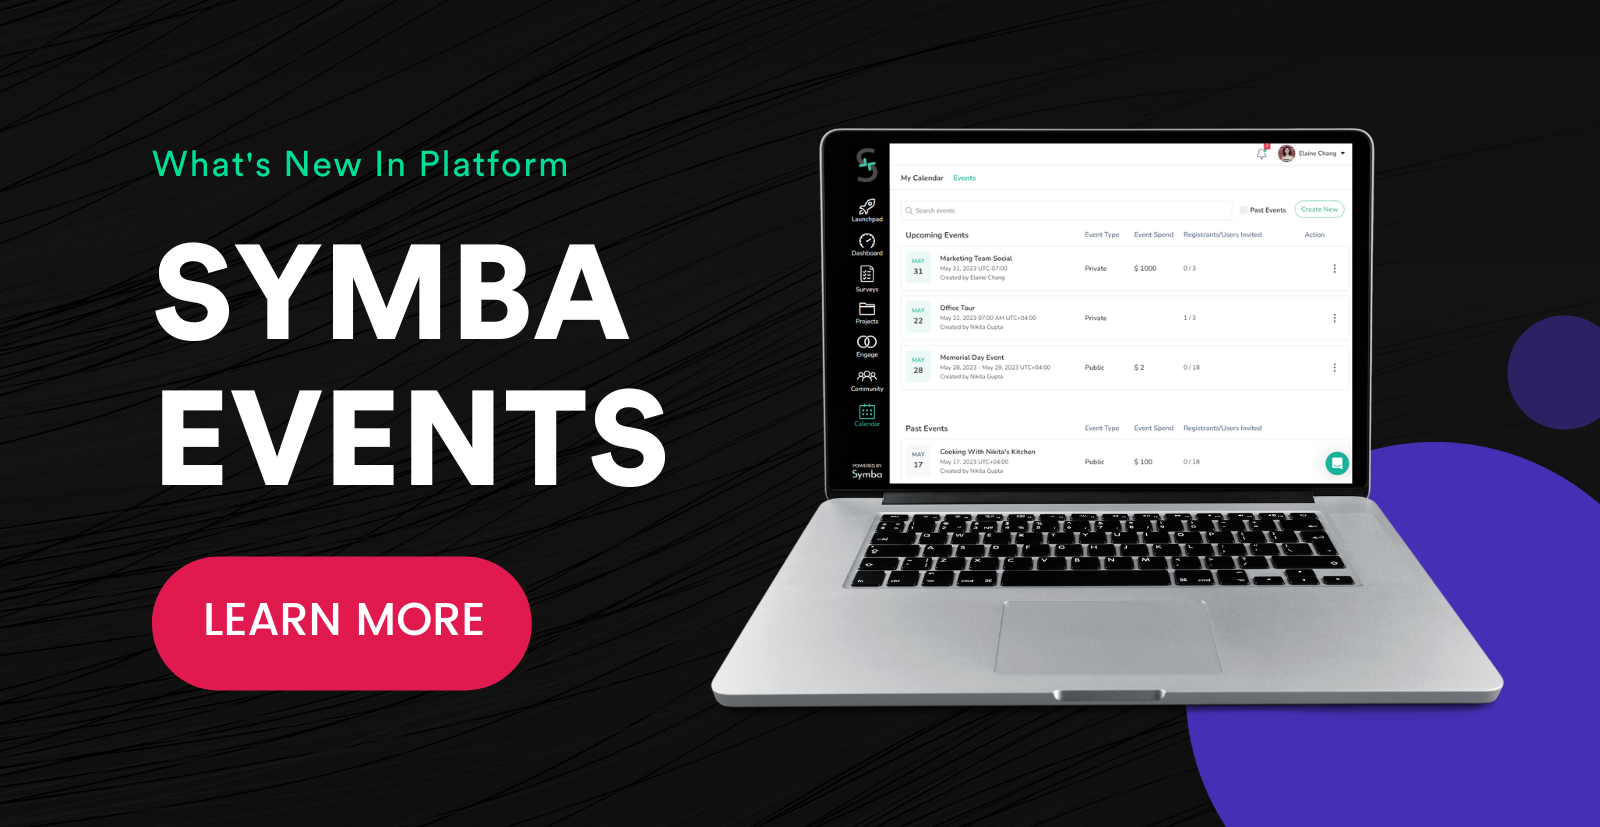
Events Dashboard
Events play a pivotal role in engaging your early talent and building community. Our new Events Dashboard pulls data from our recently launched Events feature and offers a comprehensive analysis of your events strategy. Dive into post-event survey data, including your average event rating and Net Promoter Scores (NPS). Gauge the success of your events by tracking average registration rates and comparing individual event registration rates. With this data-driven approach, you can refine your events strategy and focus on the ones that deliver the most value.
Incorporating these three powerful Dashboards into your early talent program management toolkit allows you to make smarter decisions, refine your engagement strategies, and continually enhance the effectiveness of your DEI initiatives.
Sick of tracking your program’s data in spreadsheets? Want more visibility? Drop us a line and let us know you’re interested in learning more about Symba’s Dashboards here. Dive into the data, uncover actionable insights, and take your early talent program to new heights!

